
Speed
When you sit down to eat in a restaurant or go to a cafe, if the waiter is slow to serve you, it usually displeases you and you end up having a bad experience, which is the reason you initially went to the place.
If the irritation is significant, your visit may be accompanied by a negative review on services like Google Business and Tripadvisor to warn other potential customers not to choose it.
In the same way, low website speed can lead to a poor experience for visitors and be accompanied by poor search engine rankings.
Website speed (or performance) refers to how fast a browser can load fully functional pages.
Sites with poor (slow) performance tend to drive users away.
Conversely, fast-loading sites usually get more traffic and have better conversion rates.
Speed Matters
Many studies have shown that website speed affects conversion rates (the rate at which users complete desired actions).
Not only do users stay longer on fast sites, but these sites achieve higher conversions compared to slower sites.
Some companies found that reducing page load time by mere milliseconds increases conversions:
Mobify saw a 1.11% increase in conversions by reducing homepage load by 100 ms (0.1 seconds).
Retailer AutoAnything saw 12-13% sales growth after halving load time.
Walmart discovered that a 1-second load improvement increased conversions by 2%.
Around 2006, Amazon reported every 100 ms delay in page load cost about 1% in sales.
For context, this 1% loss equaled roughly $107 million annually for Amazon, now around $3.8 billion.
100 ms delay costs $3.8 billion per year!
Google found an extra 0.5 second in search result generation decreased traffic by 20%.
A US stockbroker could lose $4 million in revenue per millisecond delay if trading platform is 5 ms slower than competitors!
Fast forward 10 years.
A 2017 Akamai study showed every 100 ms delay in page load reduces conversions by 7%, a significant sales drop.
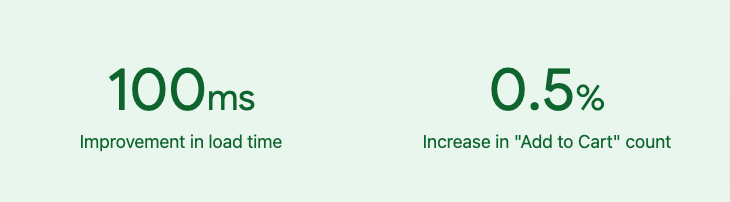
Ebay stated in 2019 that every 100 ms improvement in search page load increased “Add to cart” clicks by 0.5%.
Image 8.1: Every 100 ms speed increase in eBay page load raises add-to-cart rate by 0.5% (source: ebay.com).
Page load delay is not a choice today.
It’s a key factor influencing success or failure.
Bounce rate—the percent of users leaving after one page without interaction—rises sharply if page doesn’t fully load in seconds.
Users may close window or choose competitors.
BBC lost 10% users per additional second of page load.
Google also rewards fast sites and penalizes slow ones with lower search rankings.
What affects page speed?
-
Page size: Sites are collections of files combined to create the final visible page. Large JavaScript files, video content, heavy CSS, and high-res images add significant load time. Like a waiter serving 10 dishes instead of 2-3 slows service, more resources slow page loads.
-
Network: Even a lightweight site may load slowly due to slow networks. Local network and ISP quality (e.g., Cosmote, Vodafone) affect connectivity. Mobile devices on 3G/4G often have slower connections than WiFi. Although not fully developer-controlled, techniques like compression and CDN hosting can speed especially slow connections.
-
Hosting location (server): Resources traveling long distances cause high latency. For example, if HTML/CSS hosted in Ohio and images in Germany, a European user waits for long file travel.
Many tools help developers create fast sites.
The following principles apply to all, based on physics and computing: resources needed to “paint” a page must be requested, transferred, and decoded.
How to evaluate page speed today? Meet Web Vitals!
In May 2020, Google announced Core Web Vitals (web.dev/vitals).
Core Web Vitals are user-centered measurements designed to assess a page’s health regarding smooth and uninterrupted experience.
Google says optimizing user experience quality is key to long-term website success.
Whether a business owner, marketer, or developer, Web Vitals help quantify your site’s experience and find improvement opportunities.
Web Vitals unify quality signals essential for great user experience.
Previously, many tools measured site performance, some for experts, but lack of standard definitions confused people about what is good.
Site owners don’t need to be web performance gurus to understand user experience quality.
The goal of Web Vitals is to simplify and focus attention on the most important measurements.
Core Web Vitals apply to all sites, must be measured by site owners, and feature in all Google tools.
Each Core Web Vital captures a distinct user experience aspect, measured in-field reflecting a critical user-centered outcome.
Currently, Core Web Vitals focus on three UX dimensions: loading, interactivity, visual stability, measured as:
Image 8.2: Core Web Vitals.
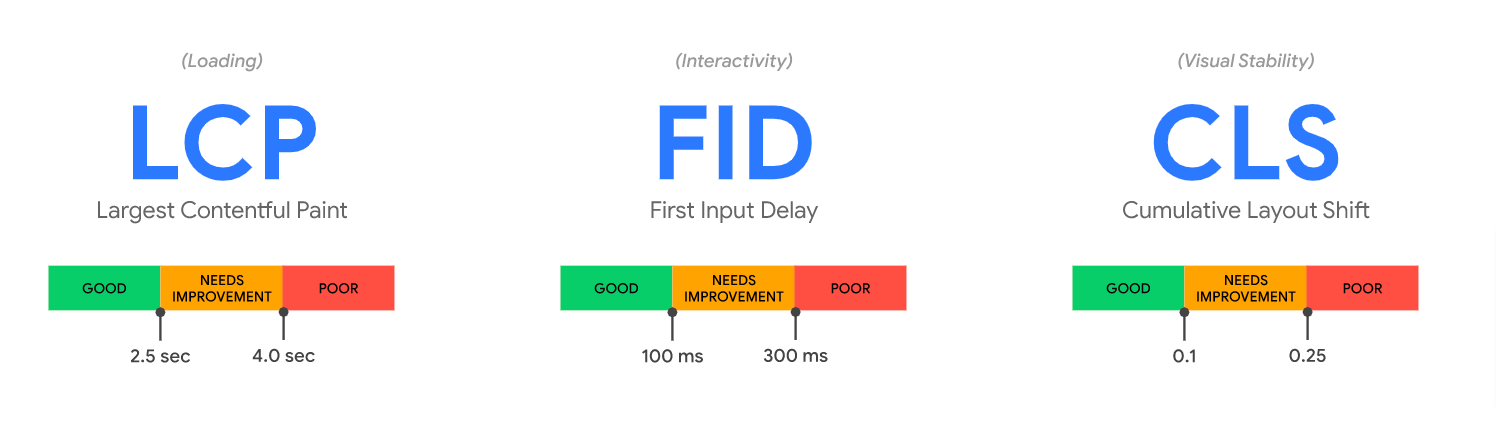
- Largest Contentful Paint (LCP): measures loading speed — time to render largest content element on screen, should be within 2.5 seconds for good UX.
- First Input Delay (FID): measures interactivity — time until page responds to visitor’s first action (e.g. click), should be 100 ms or less.
- Cumulative Layout Shift (CLS): measures visual stability — pages should keep CLS at 0.1 or less.
To ensure target for most users, measure at 75th percentile of page loads segmented by mobile and desktop.
Besides Core Web Vitals, other vital metrics exist, used complementarily.
For example, Time to First Byte (TTFB) and First Contentful Paint (FCP) aid diagnosing loading issues affecting LCP.
Similarly, Total Blocking Time (TBT) and Time to Interactive (TTI) help diagnose interaction delays impacting FID. These are lab metrics not part of Core Web Vitals as not measured in-field.
Google considers Core Web Vitals critical for all web experiences.
Therefore, these metrics show up in Google tools (e.g., Search Console) with anonymous real-user data used for ranking evaluation.
Data collected and presented by tools like Chrome UX Report (CrUX) letting owners quickly assess site performance without manual instrumentation.
Here are 3 Google tools to measure site performance via Core Web Vitals:
1. CrUX Dashboard on Data Studio.
Go to g.co/chromeuxdash.
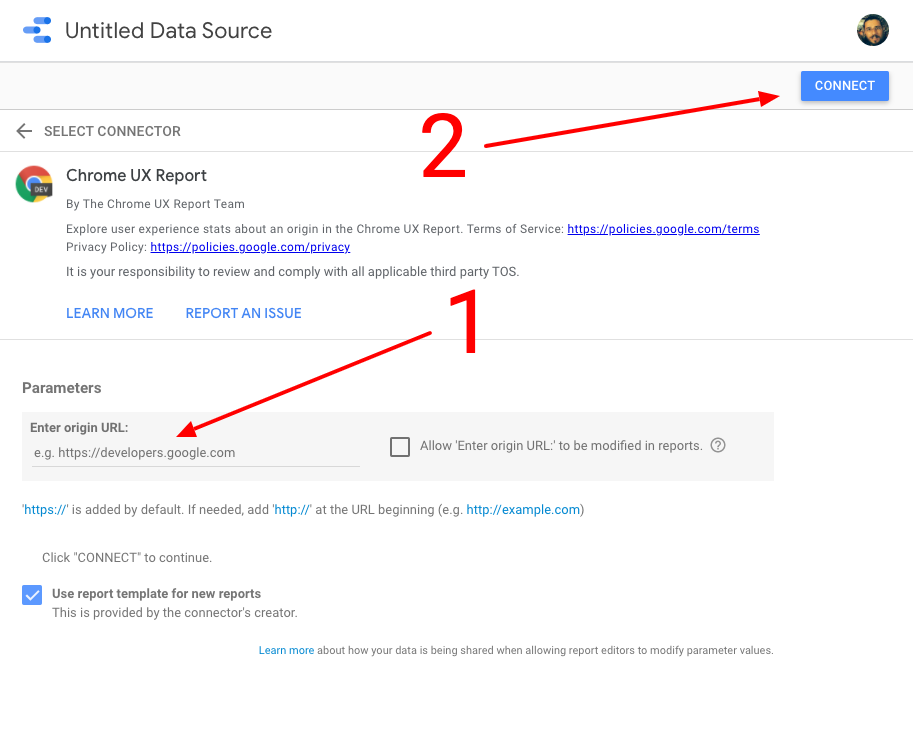
Sign in with Google account, input your site origin URL (e.g., https://arahova-pansion.gr, not subpage), and click Connect.
Image 8.3: Initial CrUX setup screen.
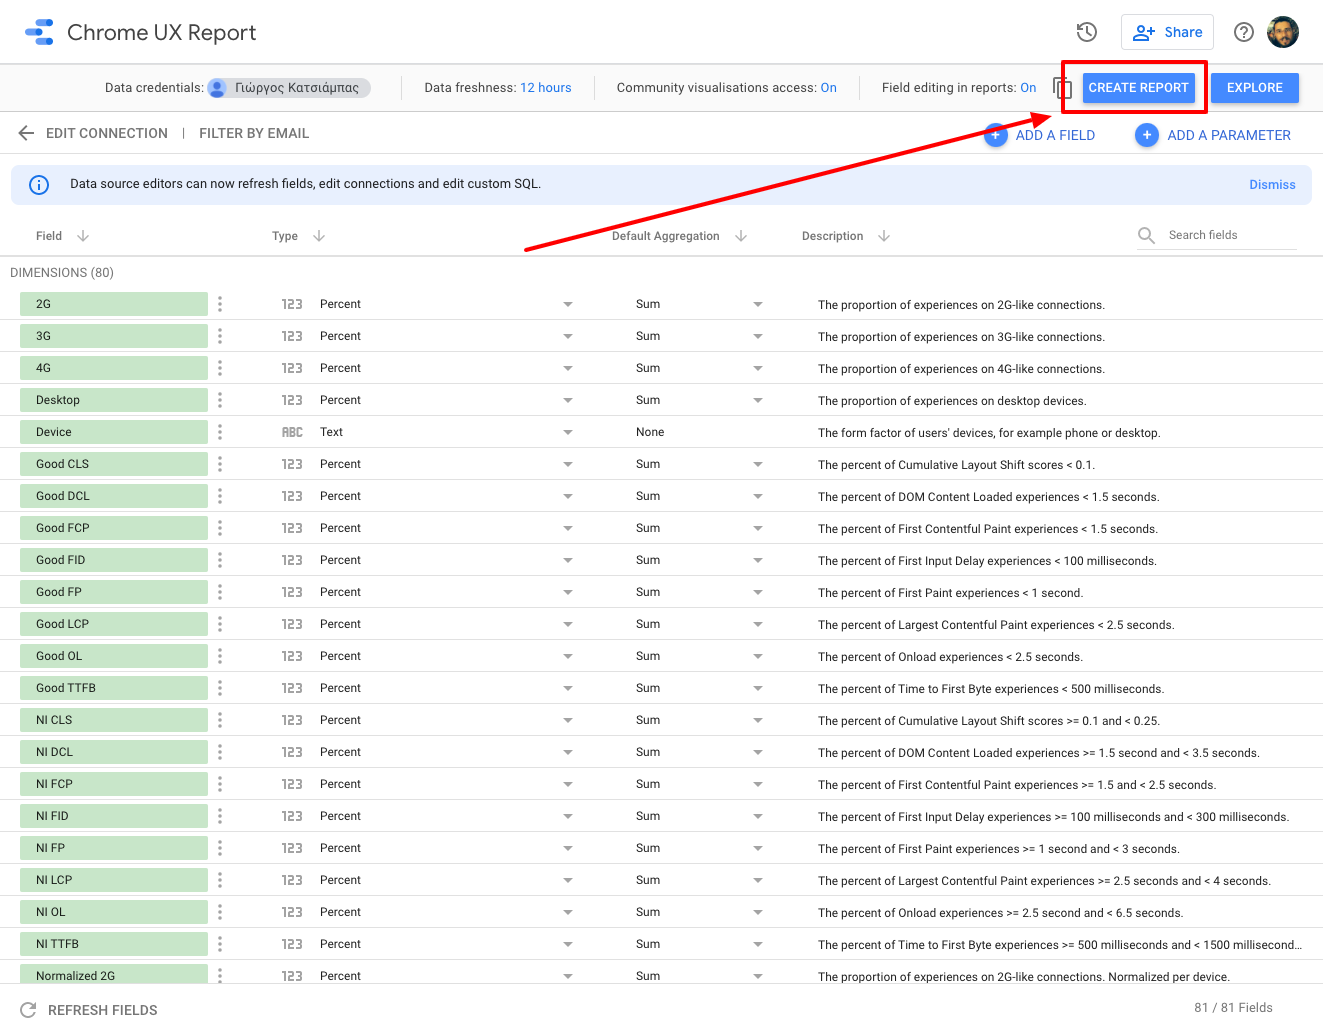
If domain found, directed to data field page, showing connection type, data month, etc.
Click Create report to proceed.
Image 8.4: Chrome UX Report data fields page.
Next page shows Core Web Vitals report for your site plus element layout choices.
Just select View to see your report. Example shown for arahova-pansion.gr.
Image 8.5: Chrome UX Report example.
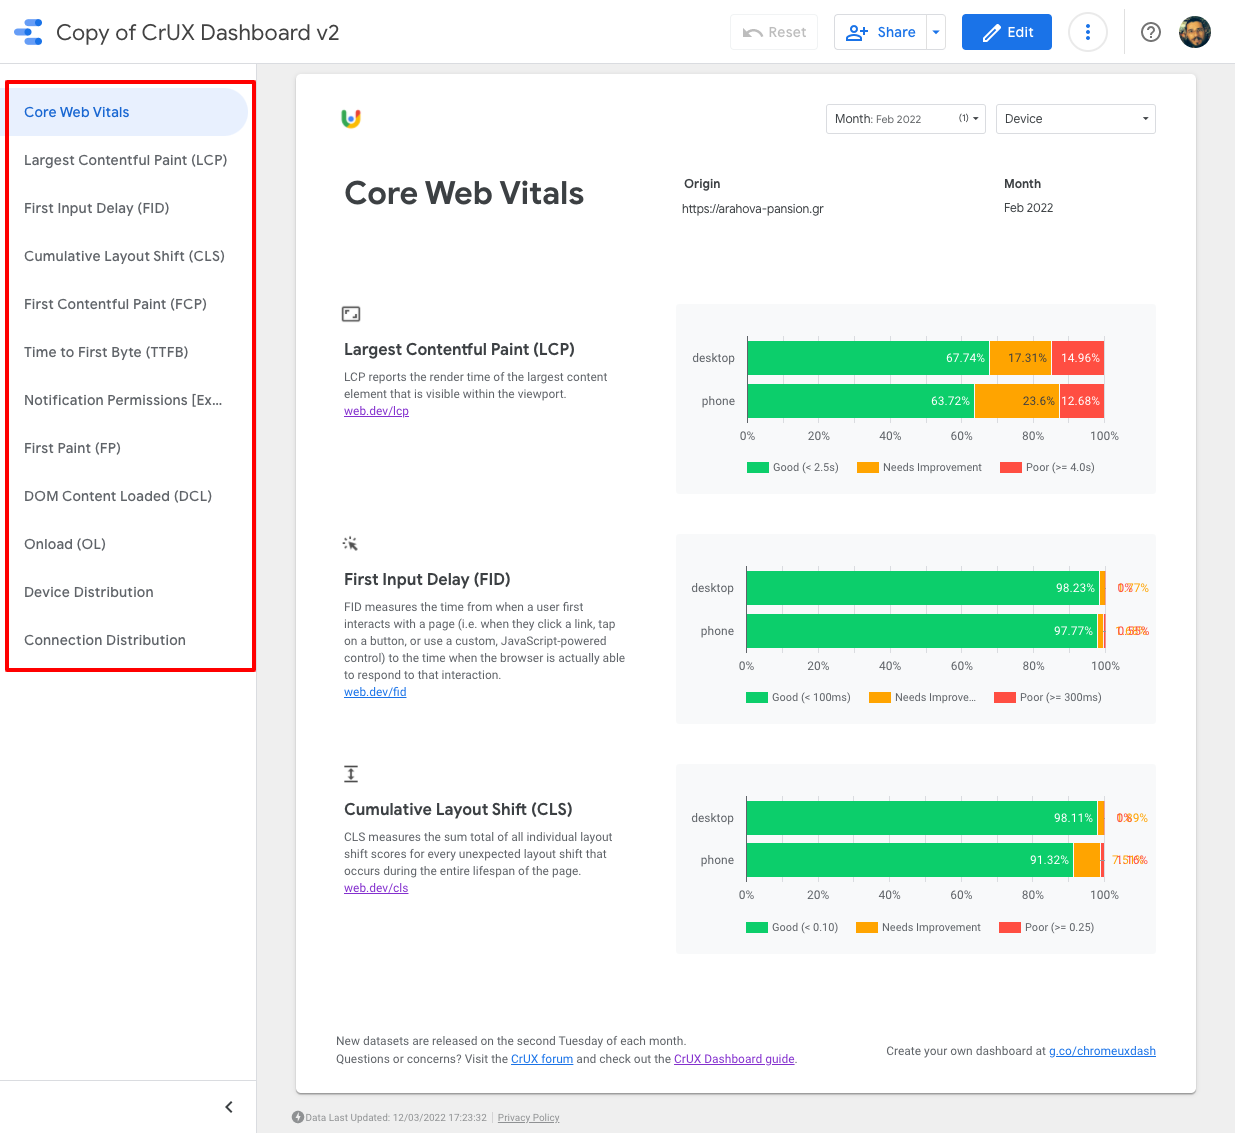
Left menu navigates each Web Vital; first option shows LCP, FID, CLS overview.
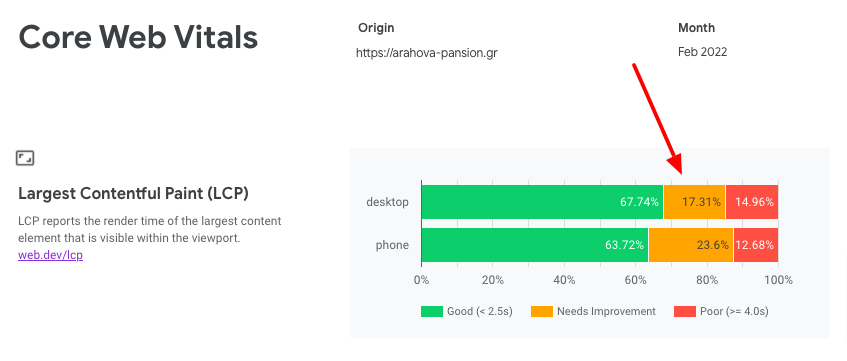
While interaction (FID) and stability (CLS) criteria are good, LCP response time needs improvement with significant visitors in orange and red zones.
Image 8.6: LCP report example needing improvement.
Choose Largest Contentful Paint in menu to see LCP over time or segmented by device (smartphone, laptop, desktop) to identify improvement areas.
Image 8.7: LCP monthly report.
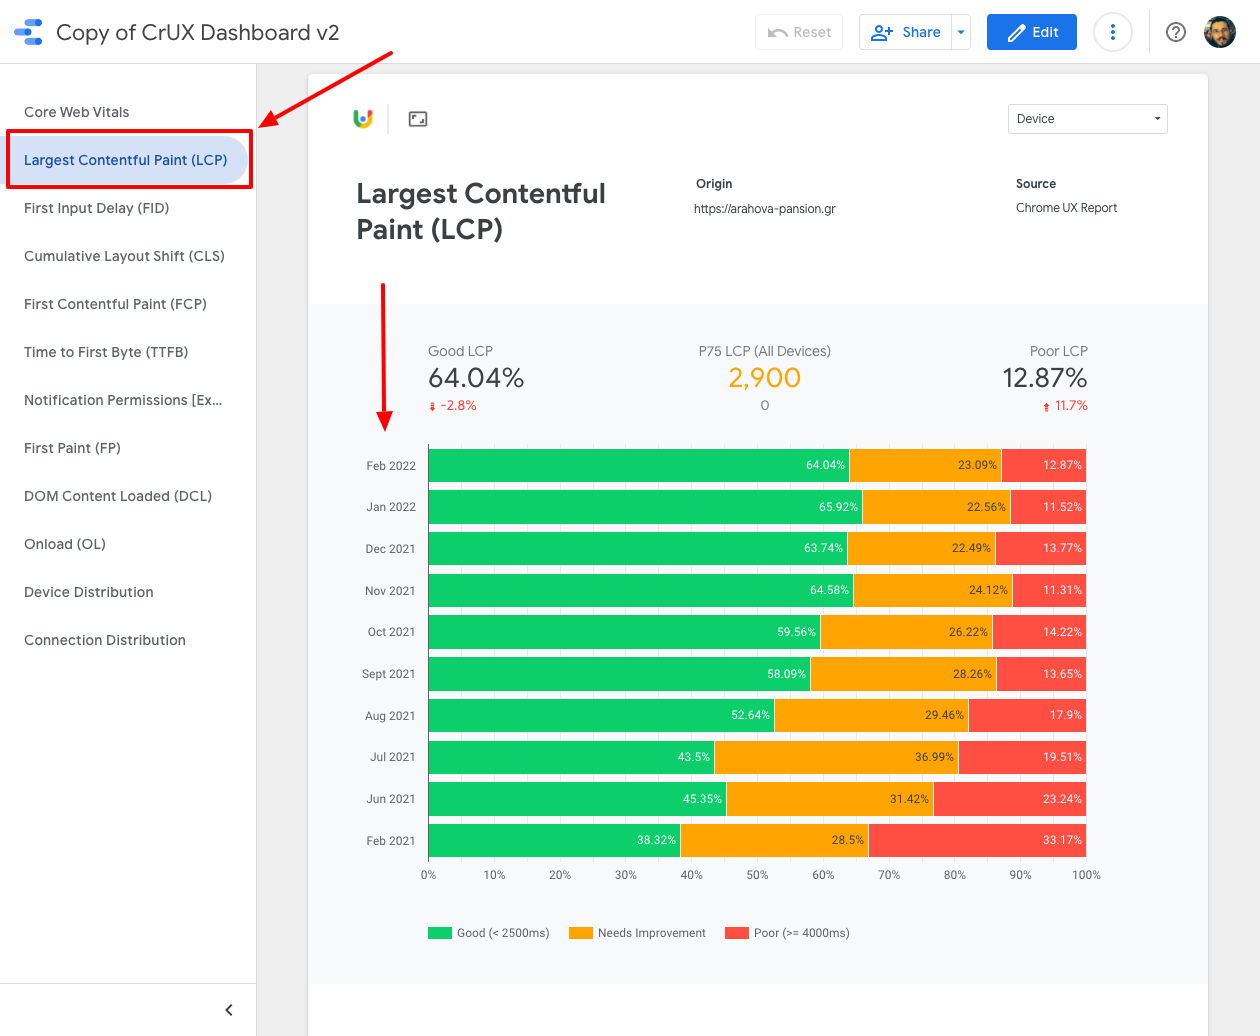
This allows non-technical owners to assess Core Web Vitals and commission improvement tasks.
Being informed helps specify what to fix and track progress over time.
2. Search Console.
Access Google Search Console Core Web Vitals report (explained in Chapter 5).
Left menu > Core Web Vitals shows Mobile and Desktop performance charts.
Image 8.8: Core Vitals overview in Search Console.
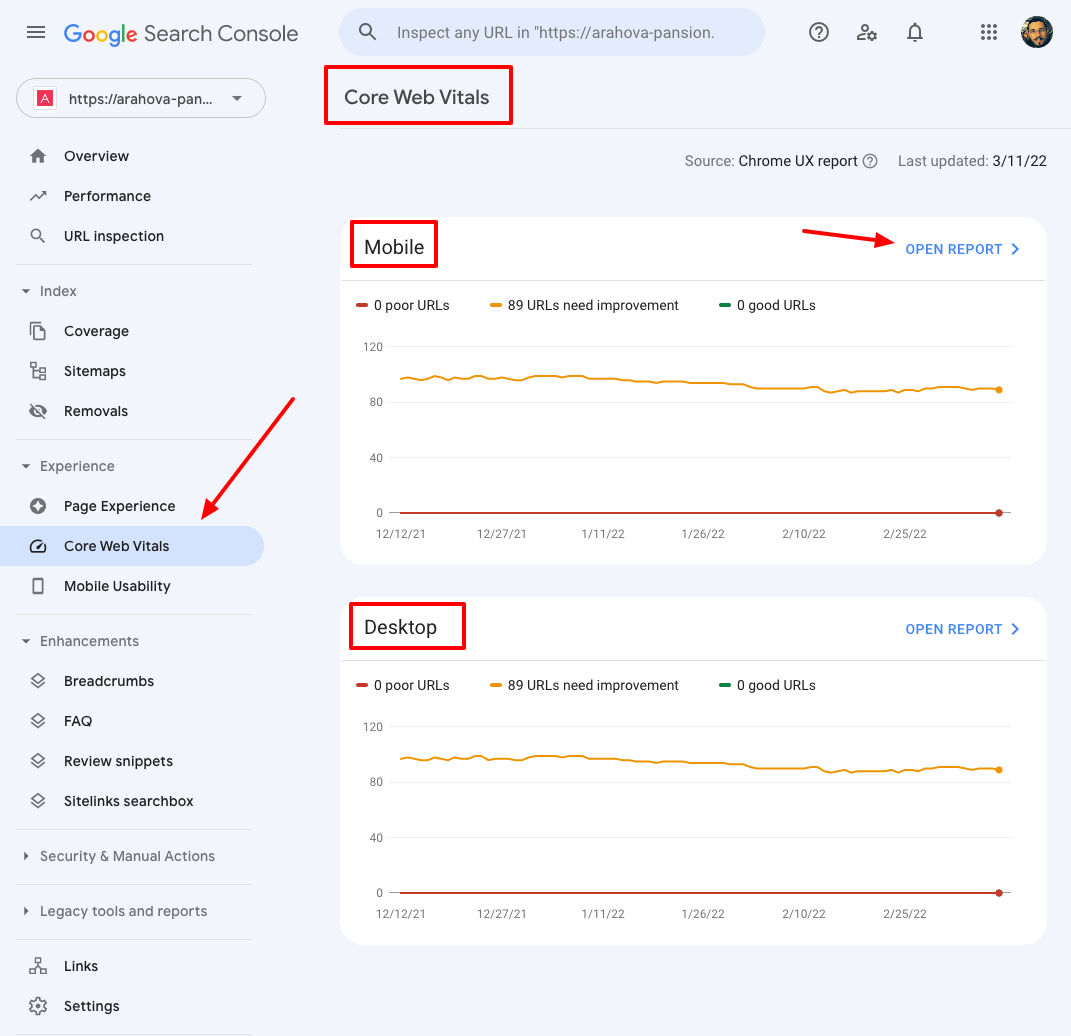
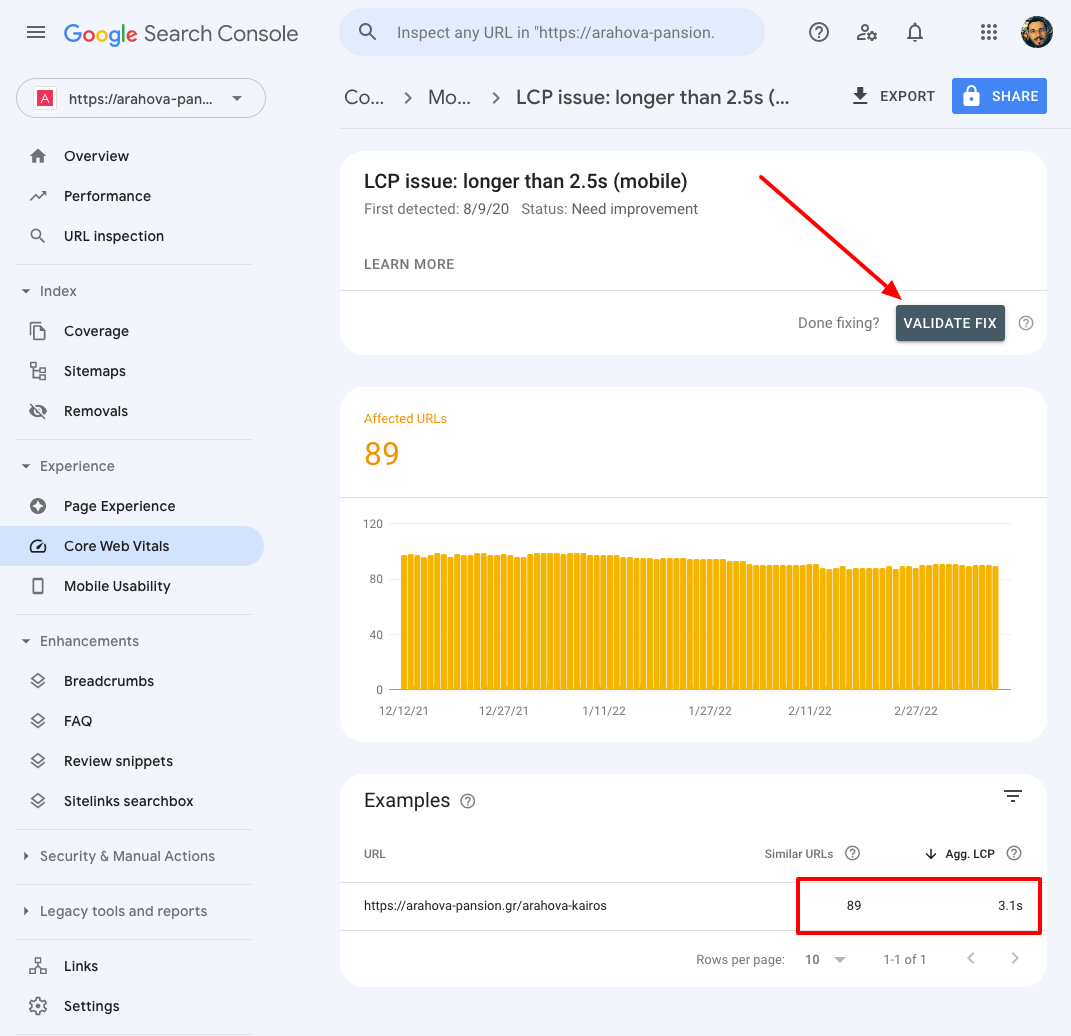
Shows 89 URLs needing improvement for arahova-pansion.gr; no good/bad URLs.
Open Report for mobile/desktop shows details by metric and problem severity.
89 pages have issues with LCP over 2 seconds.
Clicking the issue leads to list of URLs, average LCP (3.1 s) and Validate fix button to notify Google after fix.
Image 8.10: LCP monitoring page.
Even non-technical users can assess site speed and plan optimization.
3. PageSpeed Insights.
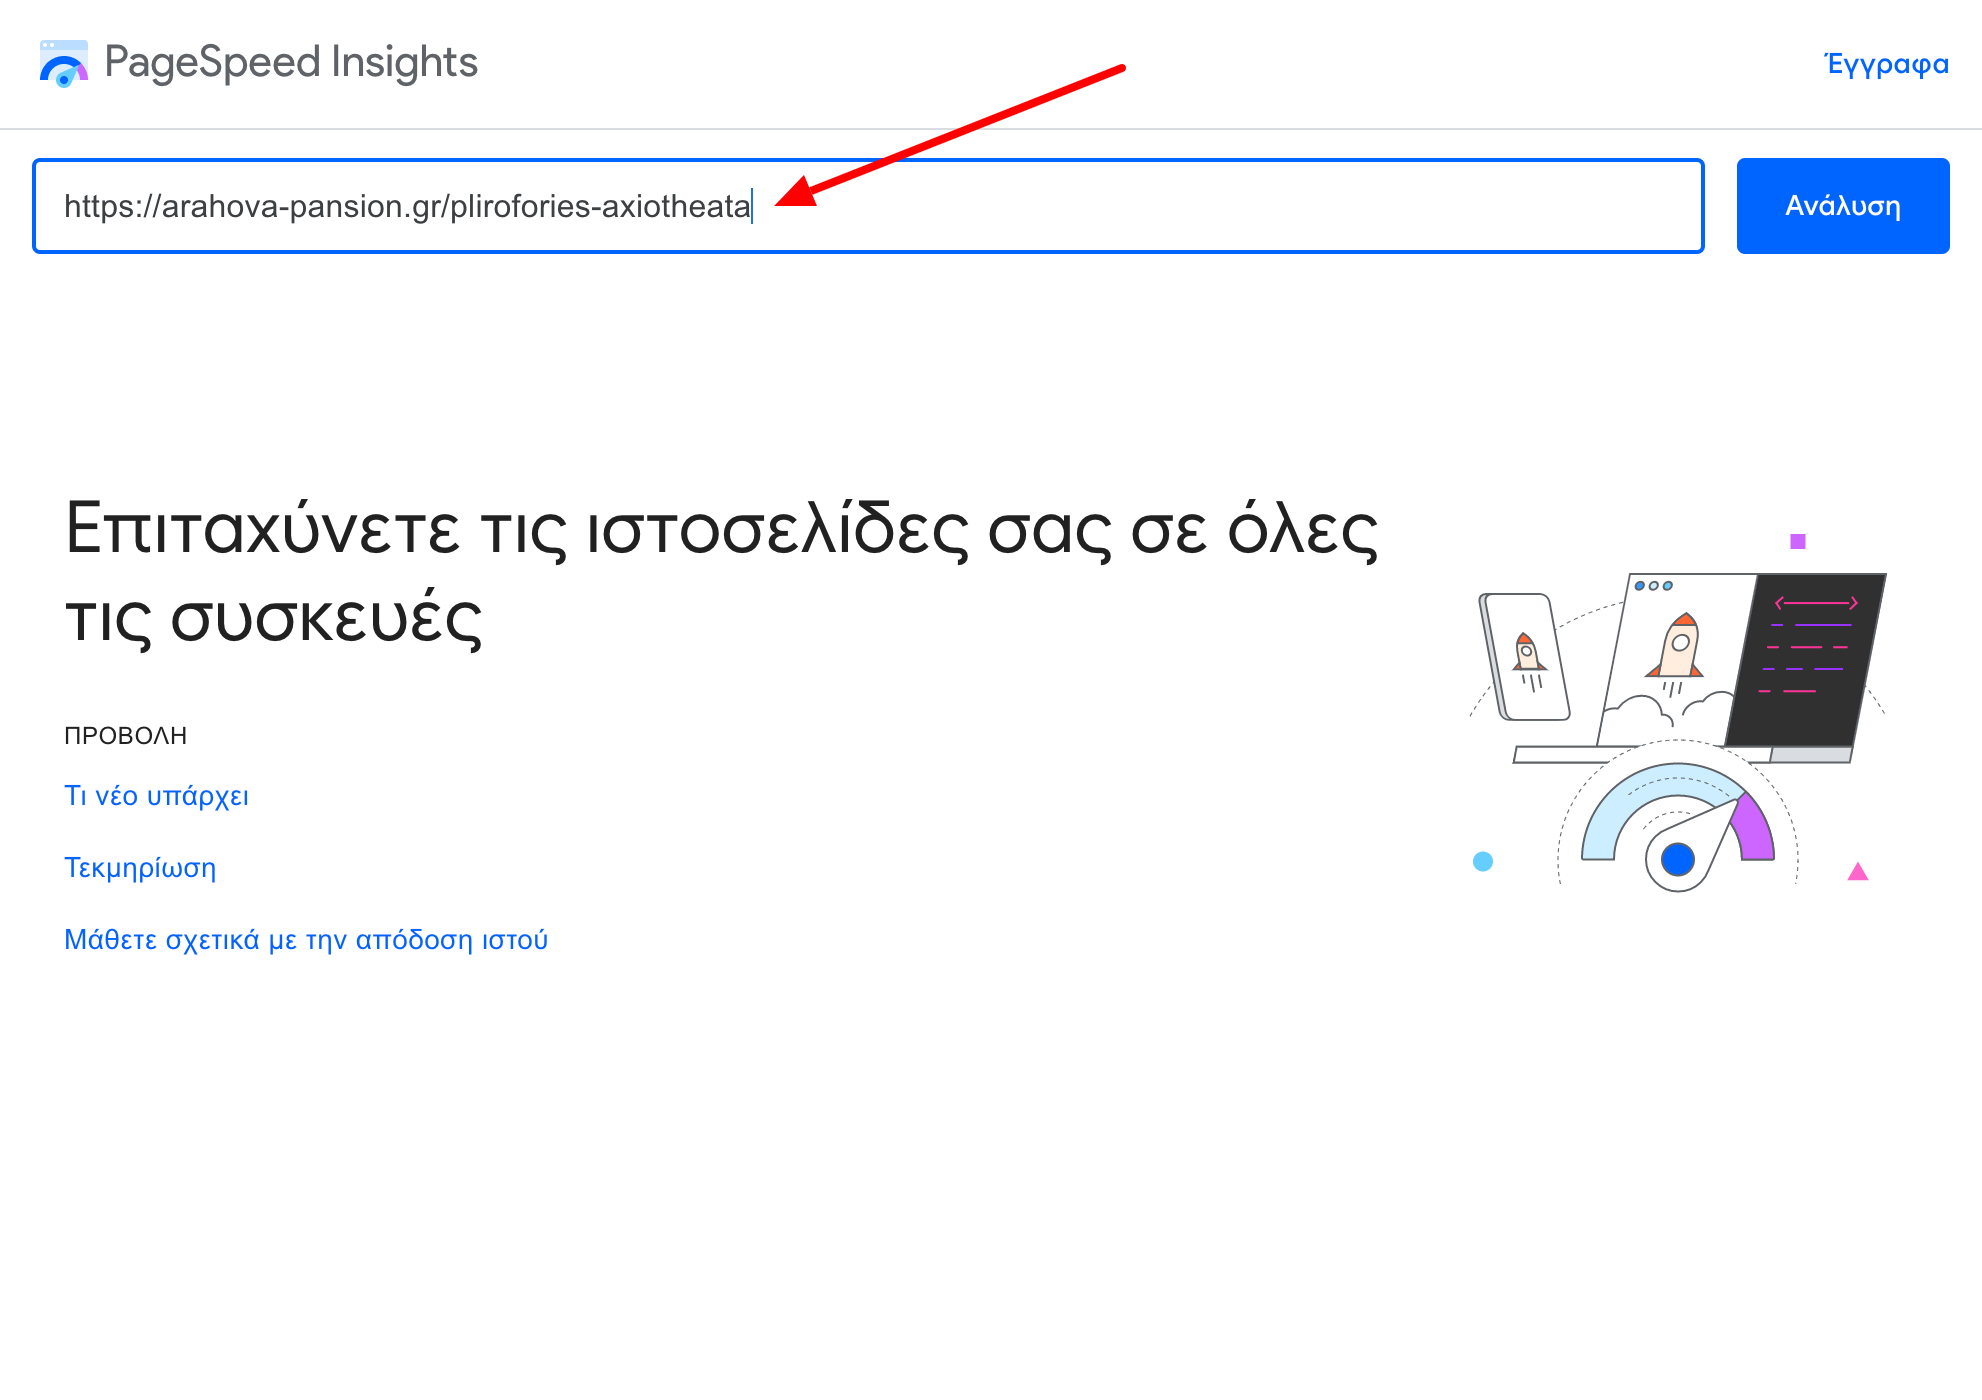
Unlike above domain-wide tools, PageSpeed Insights analyzes single URLs: https://pagespeed.web.dev.
Input valid page URL and click Analyze.
Example: arahova-pansion.gr/plirofories-axiotheata.
Image 8.11: PageSpeed Insights start page.
Select mobile or desktop analysis (mobile default).
After analysis, results like below appear.
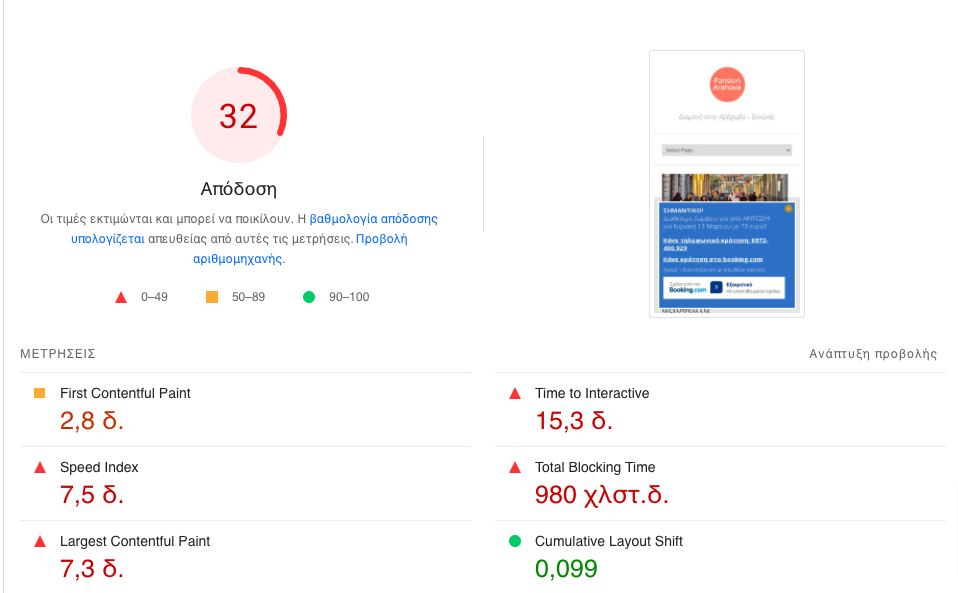
Image 8.12: PageSpeed Insights result.
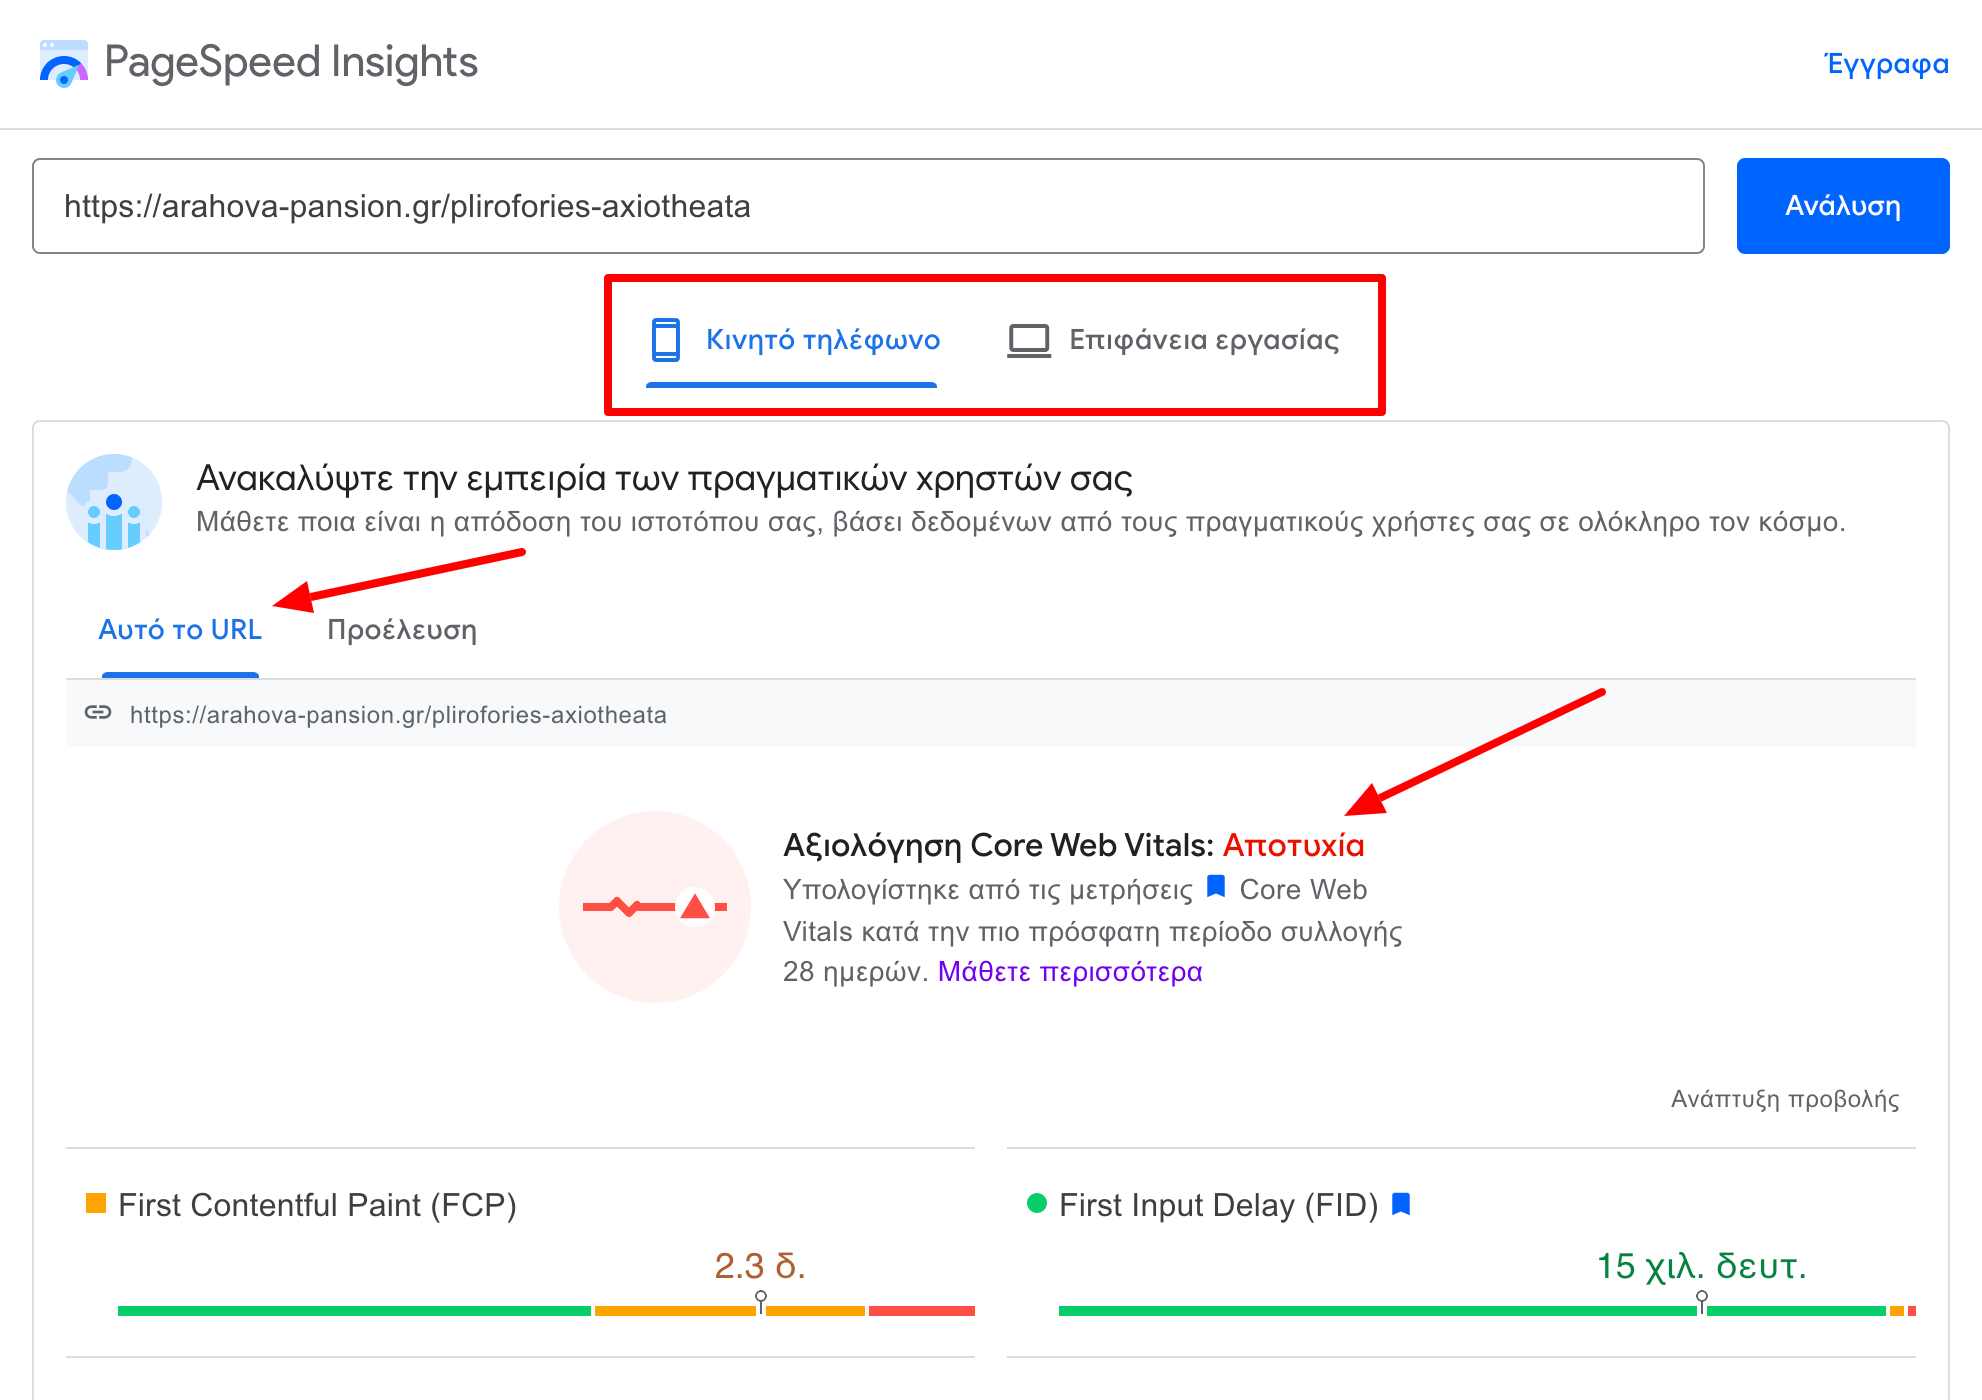
Top shows overall Core Web Vitals score (this page failed tests).
Then results for LCP, FID, CLS, FCP.
Image 8.13: Web Vitals results.
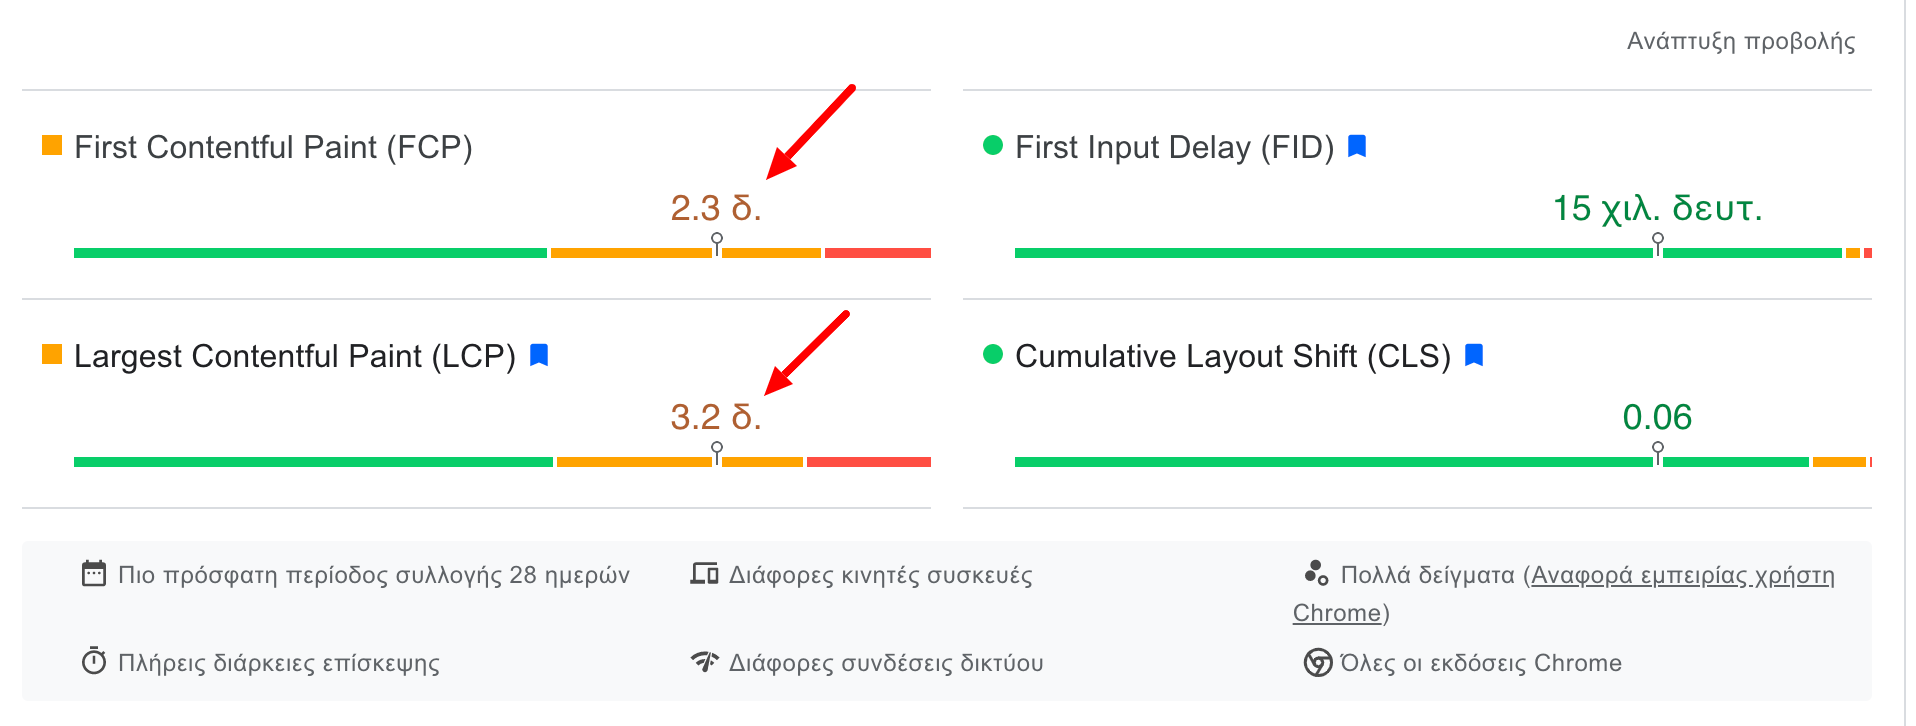
Page needs LCP improvement (orange zone), with screen content painting on mobiles after 3.2 seconds.
Known issue from previous tools; FCP also slow needing 2.3 seconds.
Either many resources delay painting or network/server issue.
Further down is overall score plus detailed metrics (First Contentful Paint, Time to Interaction, CLS, Speed Index, etc.) plus screenshot of page at test time.
Image 8.14: Web Vitals PageSpeed Insights details.
Details and improvement opportunities shown next, useful for developers and non-technical users delegating tasks.
Image 8.15: Diagnostics and opportunities.
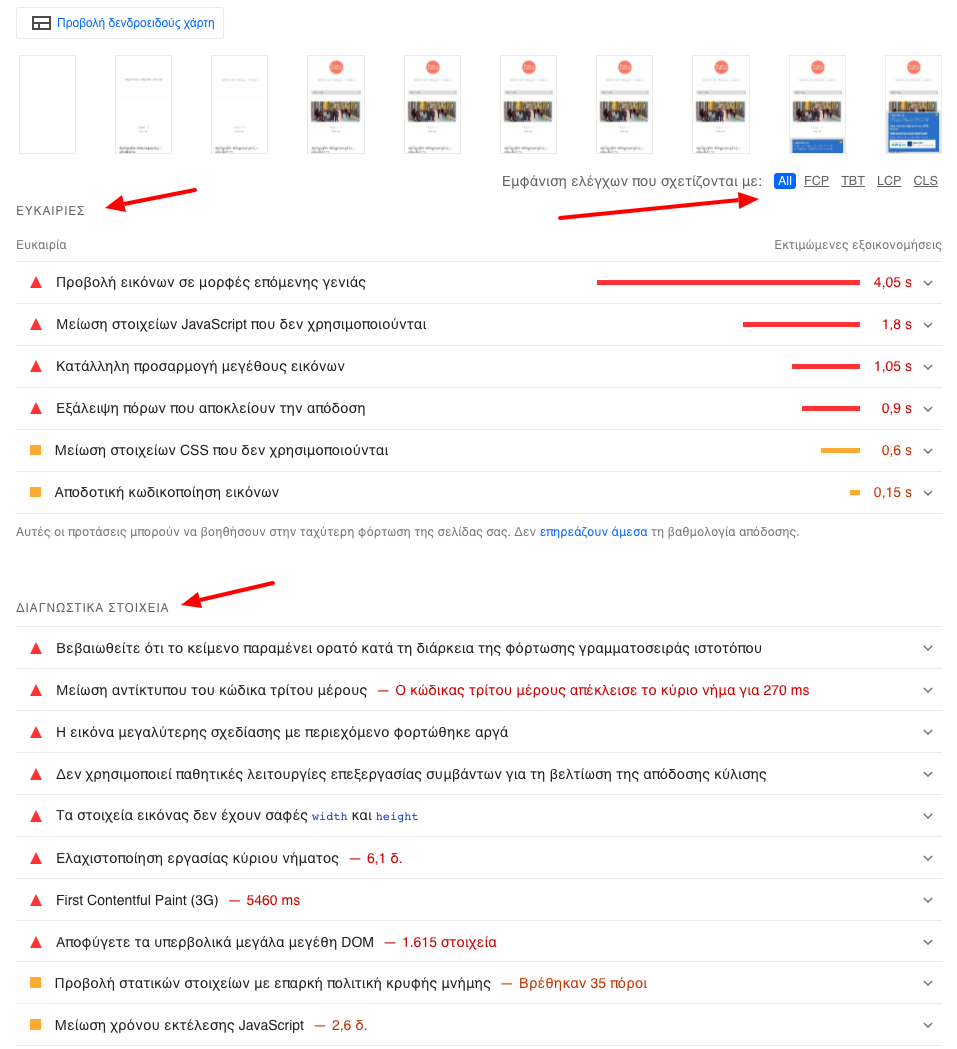
Click opportunities for details and estimated savings.
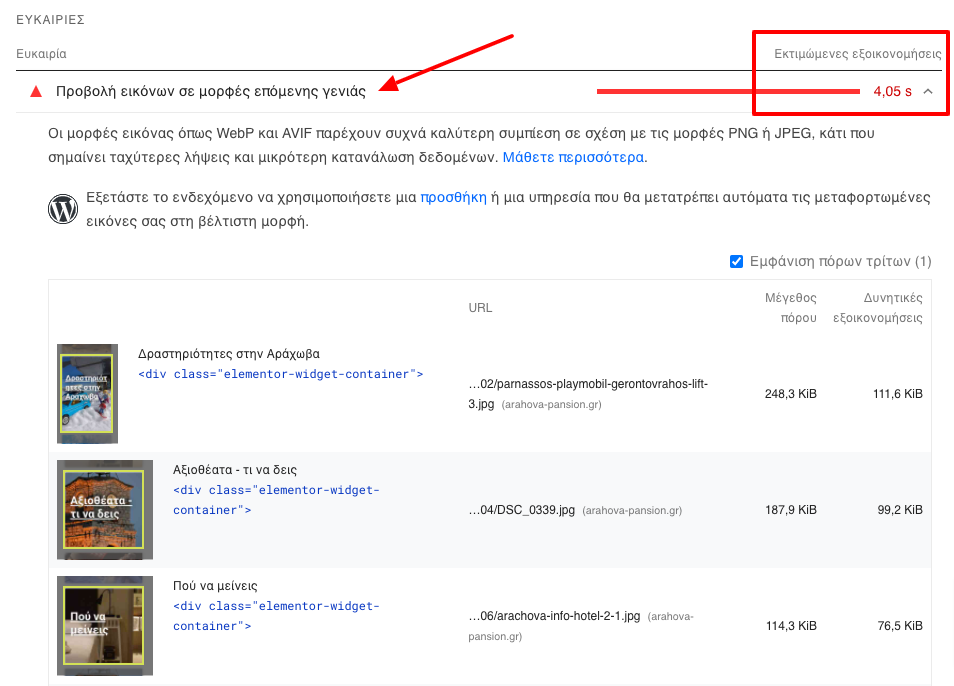
In example, serving images in next-gen formats (WebP, Avif) could save ~4 seconds total load.
Image 8.16: Image opportunities example.
For LCP-specific diagnostics, page is heavy (3.218KB), texts not immediately visible due to fonts, JS/CSS unused code, and render-blocking resources noted.
Image 8.17: LCP diagnostics.
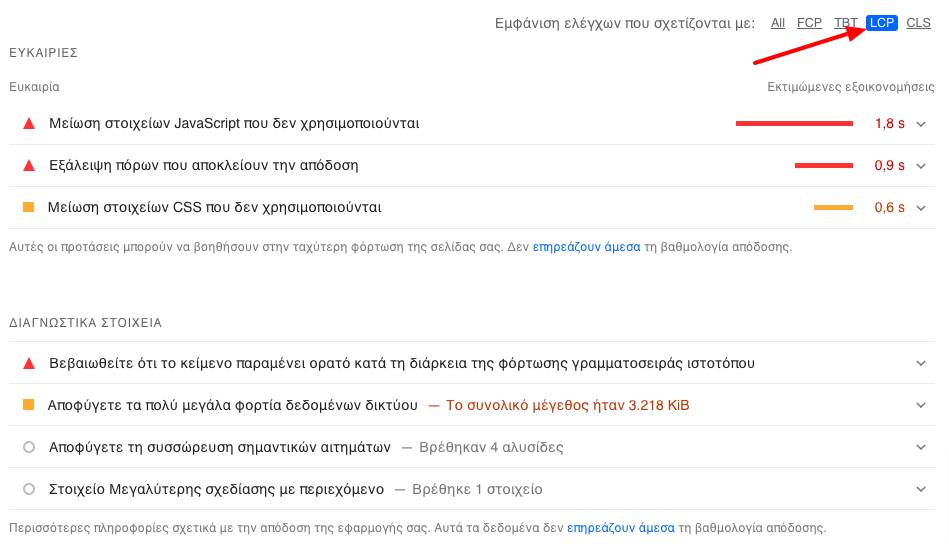
Knowing this, one can assign improvements and track progress over time.
I personally haven’t had time to implement fixes despite knowing what and how.
Site performance in load speed, responsiveness, and layout stability measures success or failure in converting visitors.
Every tenth of a second matters whether a visitor completes next step or leaves to competitors.
Web Vitals are best signals for measuring experience quality.
Future updates to Web Vitals expected but current metrics and tools suffice.
Anyone non-technical can assess site performance and developers can fix and track impacts on real users.
Official Google Web Vitals guides:
Skroutz.gr Engineering blog shares performance problem-solving articles:
engineering.skroutz.gr/tags/#performance
Fast websites and great experiences are for all. As users and site owners, we seek and provide great experiences.
Keep in mind:
-
Every fraction of a second of page load counts. Few tenths can cost hundreds or thousands of euros.
-
Web Vitals provide a unified measurement of site speed from user’s perspective.
-
Reliable free tools exist today like Chrome UX Report, Search Console, and PageSpeed Insights usable by non-experts.
Cover image: Unsplash.com